
Lies, damned lies and bird strike statistics
We’re often asked which birds cause the biggest problems for aviation.
You’d think the answer should just trip off our tongue – after all, over 30 years of managing bird strike prevention at airports must have taught us a thing or two?
But the fact is, that the answer is a lot more nuanced than you might imagine. And bare-faced bird strike statistics simply don’t tell the whole truth.
Bird strike statistics: the touchstone
There’s no shortage of data available, but much of it centres on a single airport or country. The touchstone report for global data is the ICAO (International Civil Aviation Organisation) 2008 – 2015 Wildlife Strike Analysis, based on data reported via IBIS (ICAO Bird Strike Information System).
This includes information provided by 91 states over eight years, and it contains data covering nearly 100,000 incidents.
Yet, even this barely scratches the surface when it comes to determining which birds cause the most problems for aviation.
Bird strike statistics: the problem with interpretation
First of all, the data available, vast as it may seem, only actually covers incidents that were reported via IBIS to the ICAO.
And this data is very heavily skewed – 95% of it comes from Europe and North America. This is, in small part, a reflection of the volume of flights, but it is mainly indicative of the compliance of these regions with international reporting requests.
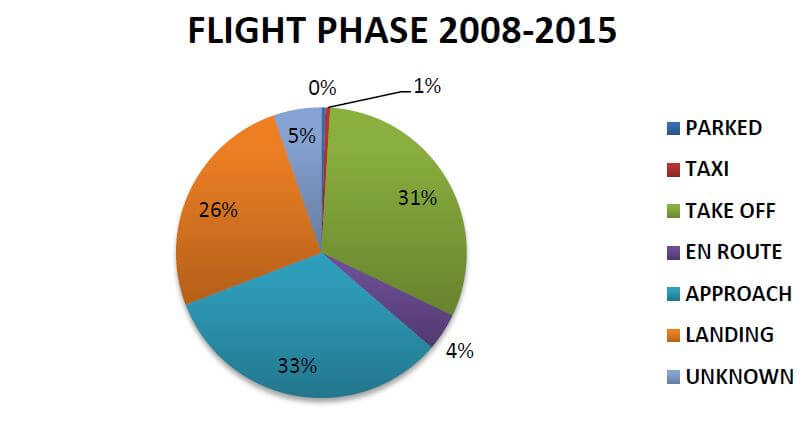
Bird strike statistics (ICAO) for the flight phase at which incidents occur
Secondly, in this already severely compromised data set, only half of the reported incidents actually identify the wildlife involved.
Further factors that give the lie to available bird strike statistics include:
- The need to consider not just the number of incidents but their severity (in terms of injury, loss of life, damage to plane, disruption)
- The effect that the time of year may have
Regarding the latter, it appears as if the biggest problem occurs in the summer months.
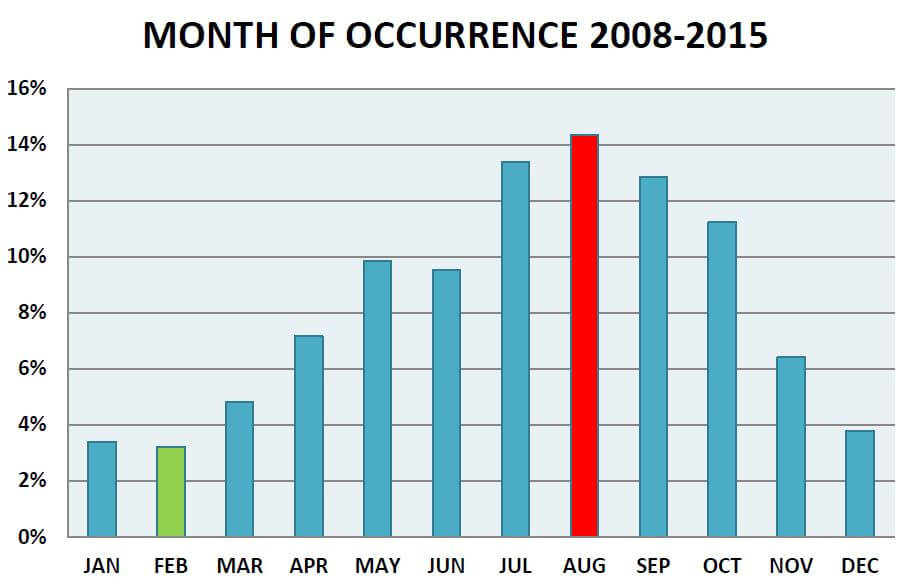
Bird strike statistics (ICAO) charting seasonality
But caution before jumping to conclusions is required here. The ICAO comments that:
‘This monthly distribution also reflects the fact that the majority of the wildlife strikes were reported by States located in the Northern Hemisphere.’
In effect, this is the seasonal trend for a specific geographic area – not a global trend.
Regarding factoring in the severity of the bird strike: only a third of the data received records this, but 92% of these incidents resulted in no reported damage to the plane.
An even smaller proportion records whether the strike affected the flight and, despite the obvious data skew to those that did, only 20% of these incidents resulted in any form of disruption.
With such a small percentage of bird strikes actually causing a problem to flights – just looking at numbers of incidents by types of birds will tell only a fraction of the story.
So, if you take these figures with a large pinch of interpretive salt, here are the birds that cause aviation the most problems.
Bird strike statistics: the birds most often involved across the globe
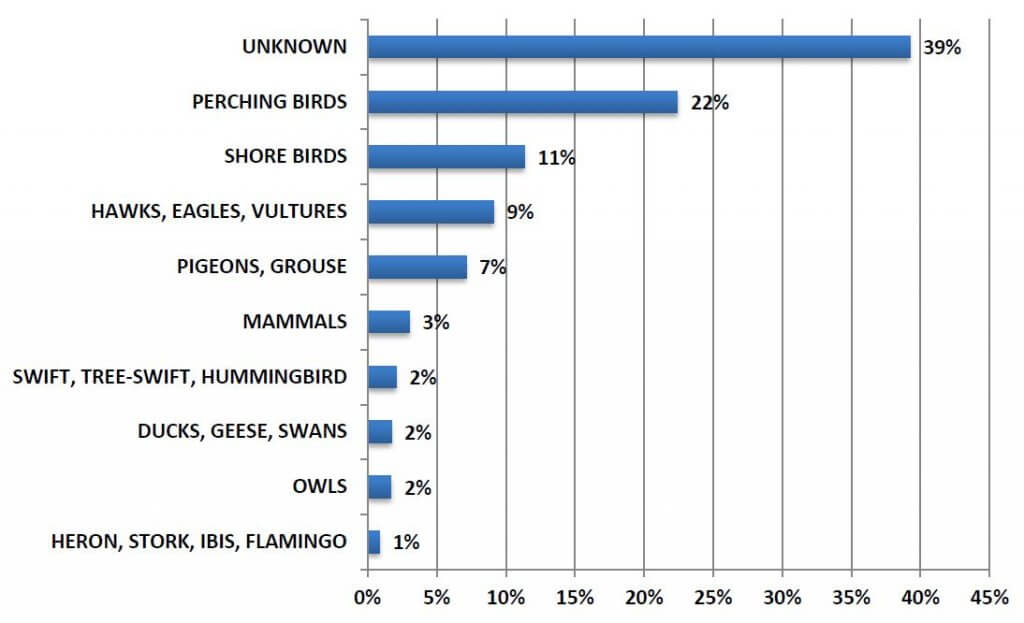
Bird strike statistics (ICAO) showing type of bird involved
The majority of bird strikes are caused by species X (unknown): not particularly helpful for bird strike prevention initiatives but a fact nonetheless.
Of the remaining 60% of reported strikes here are the scores on the doors.
1. Perching birds account for 22%
With larks, sparrows and starlings making up three-quarters of these.
2. Shore birds account for 11%
With gulls and terns making up just over half. The larger gulls, with their tendency to fly in sizable flocks, are involved in many bird strikes where significant damage is caused.
3. Raptors – such as hawks, eagles and vultures – account for 9%
With the Eurasian and American kestrel making up over half of these. Although smaller in number, these larger birds can pose a greater threat to airline safety.
4. Pigeons, doves and swifts account for 9%
With doves making up nearly two-thirds and pigeons and swifts being the vast majority of the remainder.
5. Ducks, geese and swan account for just 2%
It’s ducks and geese that make up the bulk here – and these large birds tend to fly in significant flocks. As a result they are disproportionately responsible for damage to planes compared to the relatively small numbers of recorded incidents they are involved in.
In parts of America, Canada geese and migratory snow geese populations have risen significantly in the last few years – and feral Canada geese and greylag geese have also increased in numbers in parts of Europe.
Bird strike statistics: a counterbalance
So we have revealed the five most common types of bird involved in bird strikes – alongside a whole host of caveats to bear in mind when considering such data.
Perhaps the last word should go to the Smithsonian Institute.
Their Feather Identification Laboratory has ignored frequency to try and determine which birds pose the greatest risk in terms of damage caused to planes.
Their results didn’t include pigeons, starlings or sparrows. Instead, they identified turkey vultures as the most damaging birds, followed by Canada geese and white pelicans.
These would be the same white pelicans who accounted for just nine reported incidents in the ICAO bird strike statistics.
‘99 percent of all statistics only tell 49 percent of the story.’
Ron DeLegge II